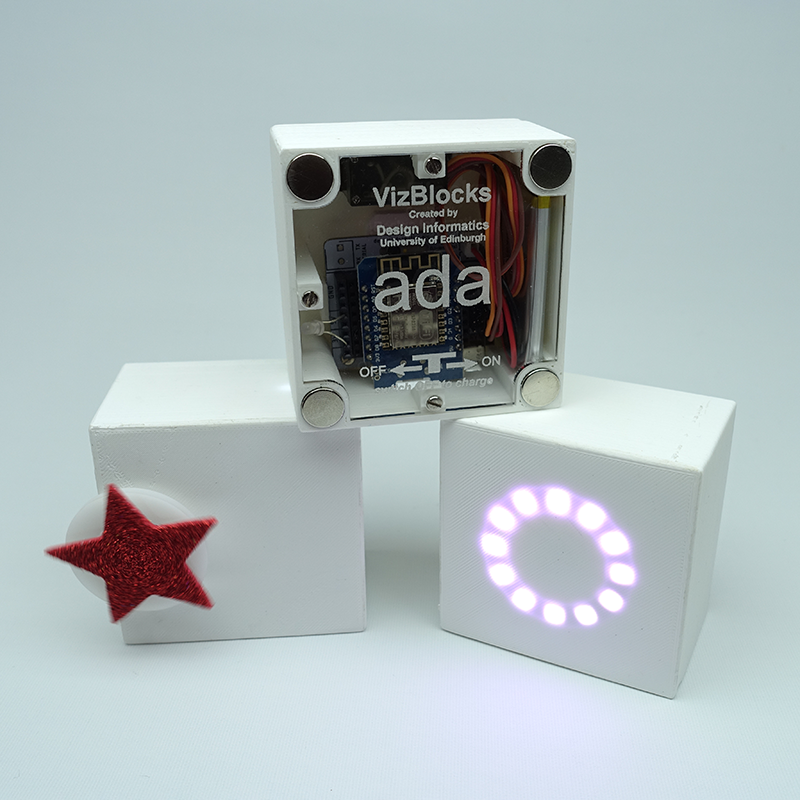
VizBlocks is a dynamic data visualisation kit which offers public audiences new ways of physically representing data using a modular kit. With a range of materials, mechanisms and tools, VizBlocks can be used to translate data into playful and engaging physical data displays.
VizBlocks is a project by The Centre for Design Informatics at The University of Edinburgh.
The project was funded by Edinburgh Futures Institute.
While you can use the VizBlocks system to build your own blocks, we have a number of pre-made blocks to get you started. You can play with these blocks out of the box in your next data visualisation project, extend their capabilities with new behaviours, or use them as examples to hack together your own custom VizBlocks!
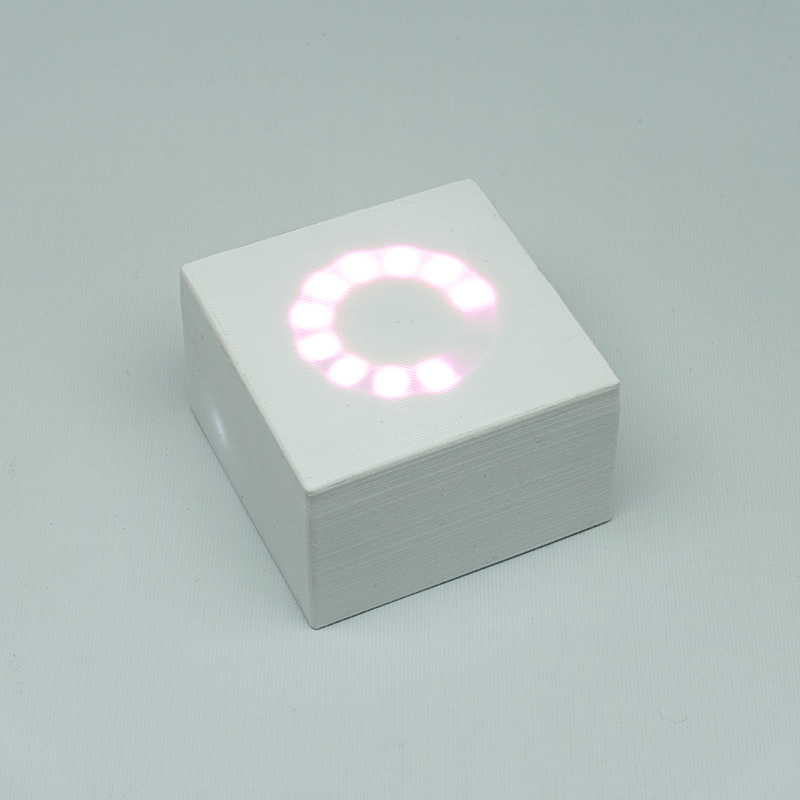
Light up your project with our LED Ring Block. Using the Breathe behaviour you could make the block glow green when there are city bikes available near your home, or with the LightSome behaviour, you could use it to count down to your next calendar event.
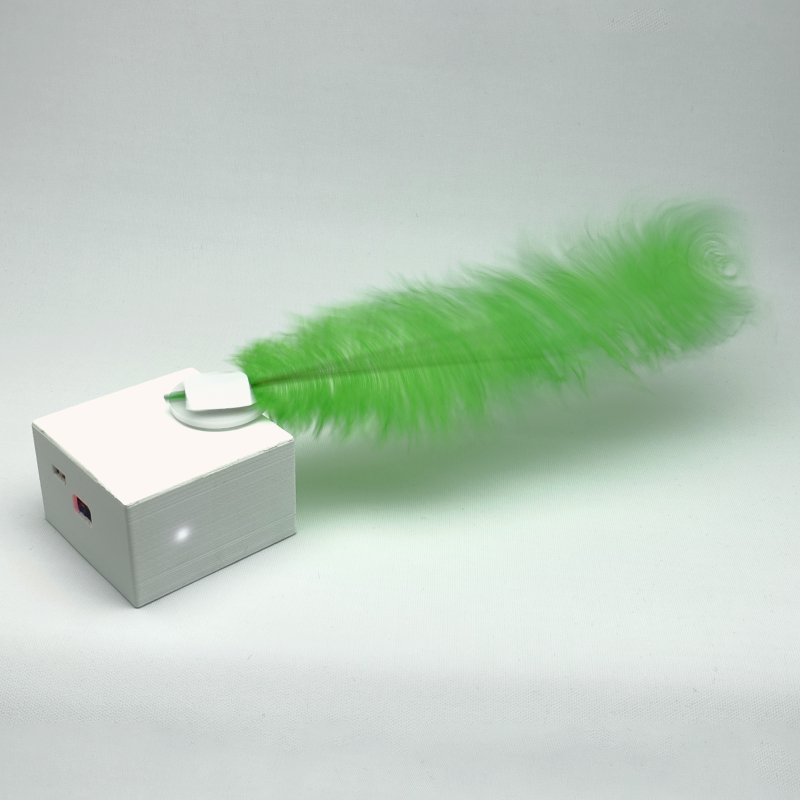
Get your project moving with the Servo Motor Block. You could try using the GoTo behaviour to build a barometer, or maybe the Wiggle behaviour to jingle a bell every time a space rocket is launched.
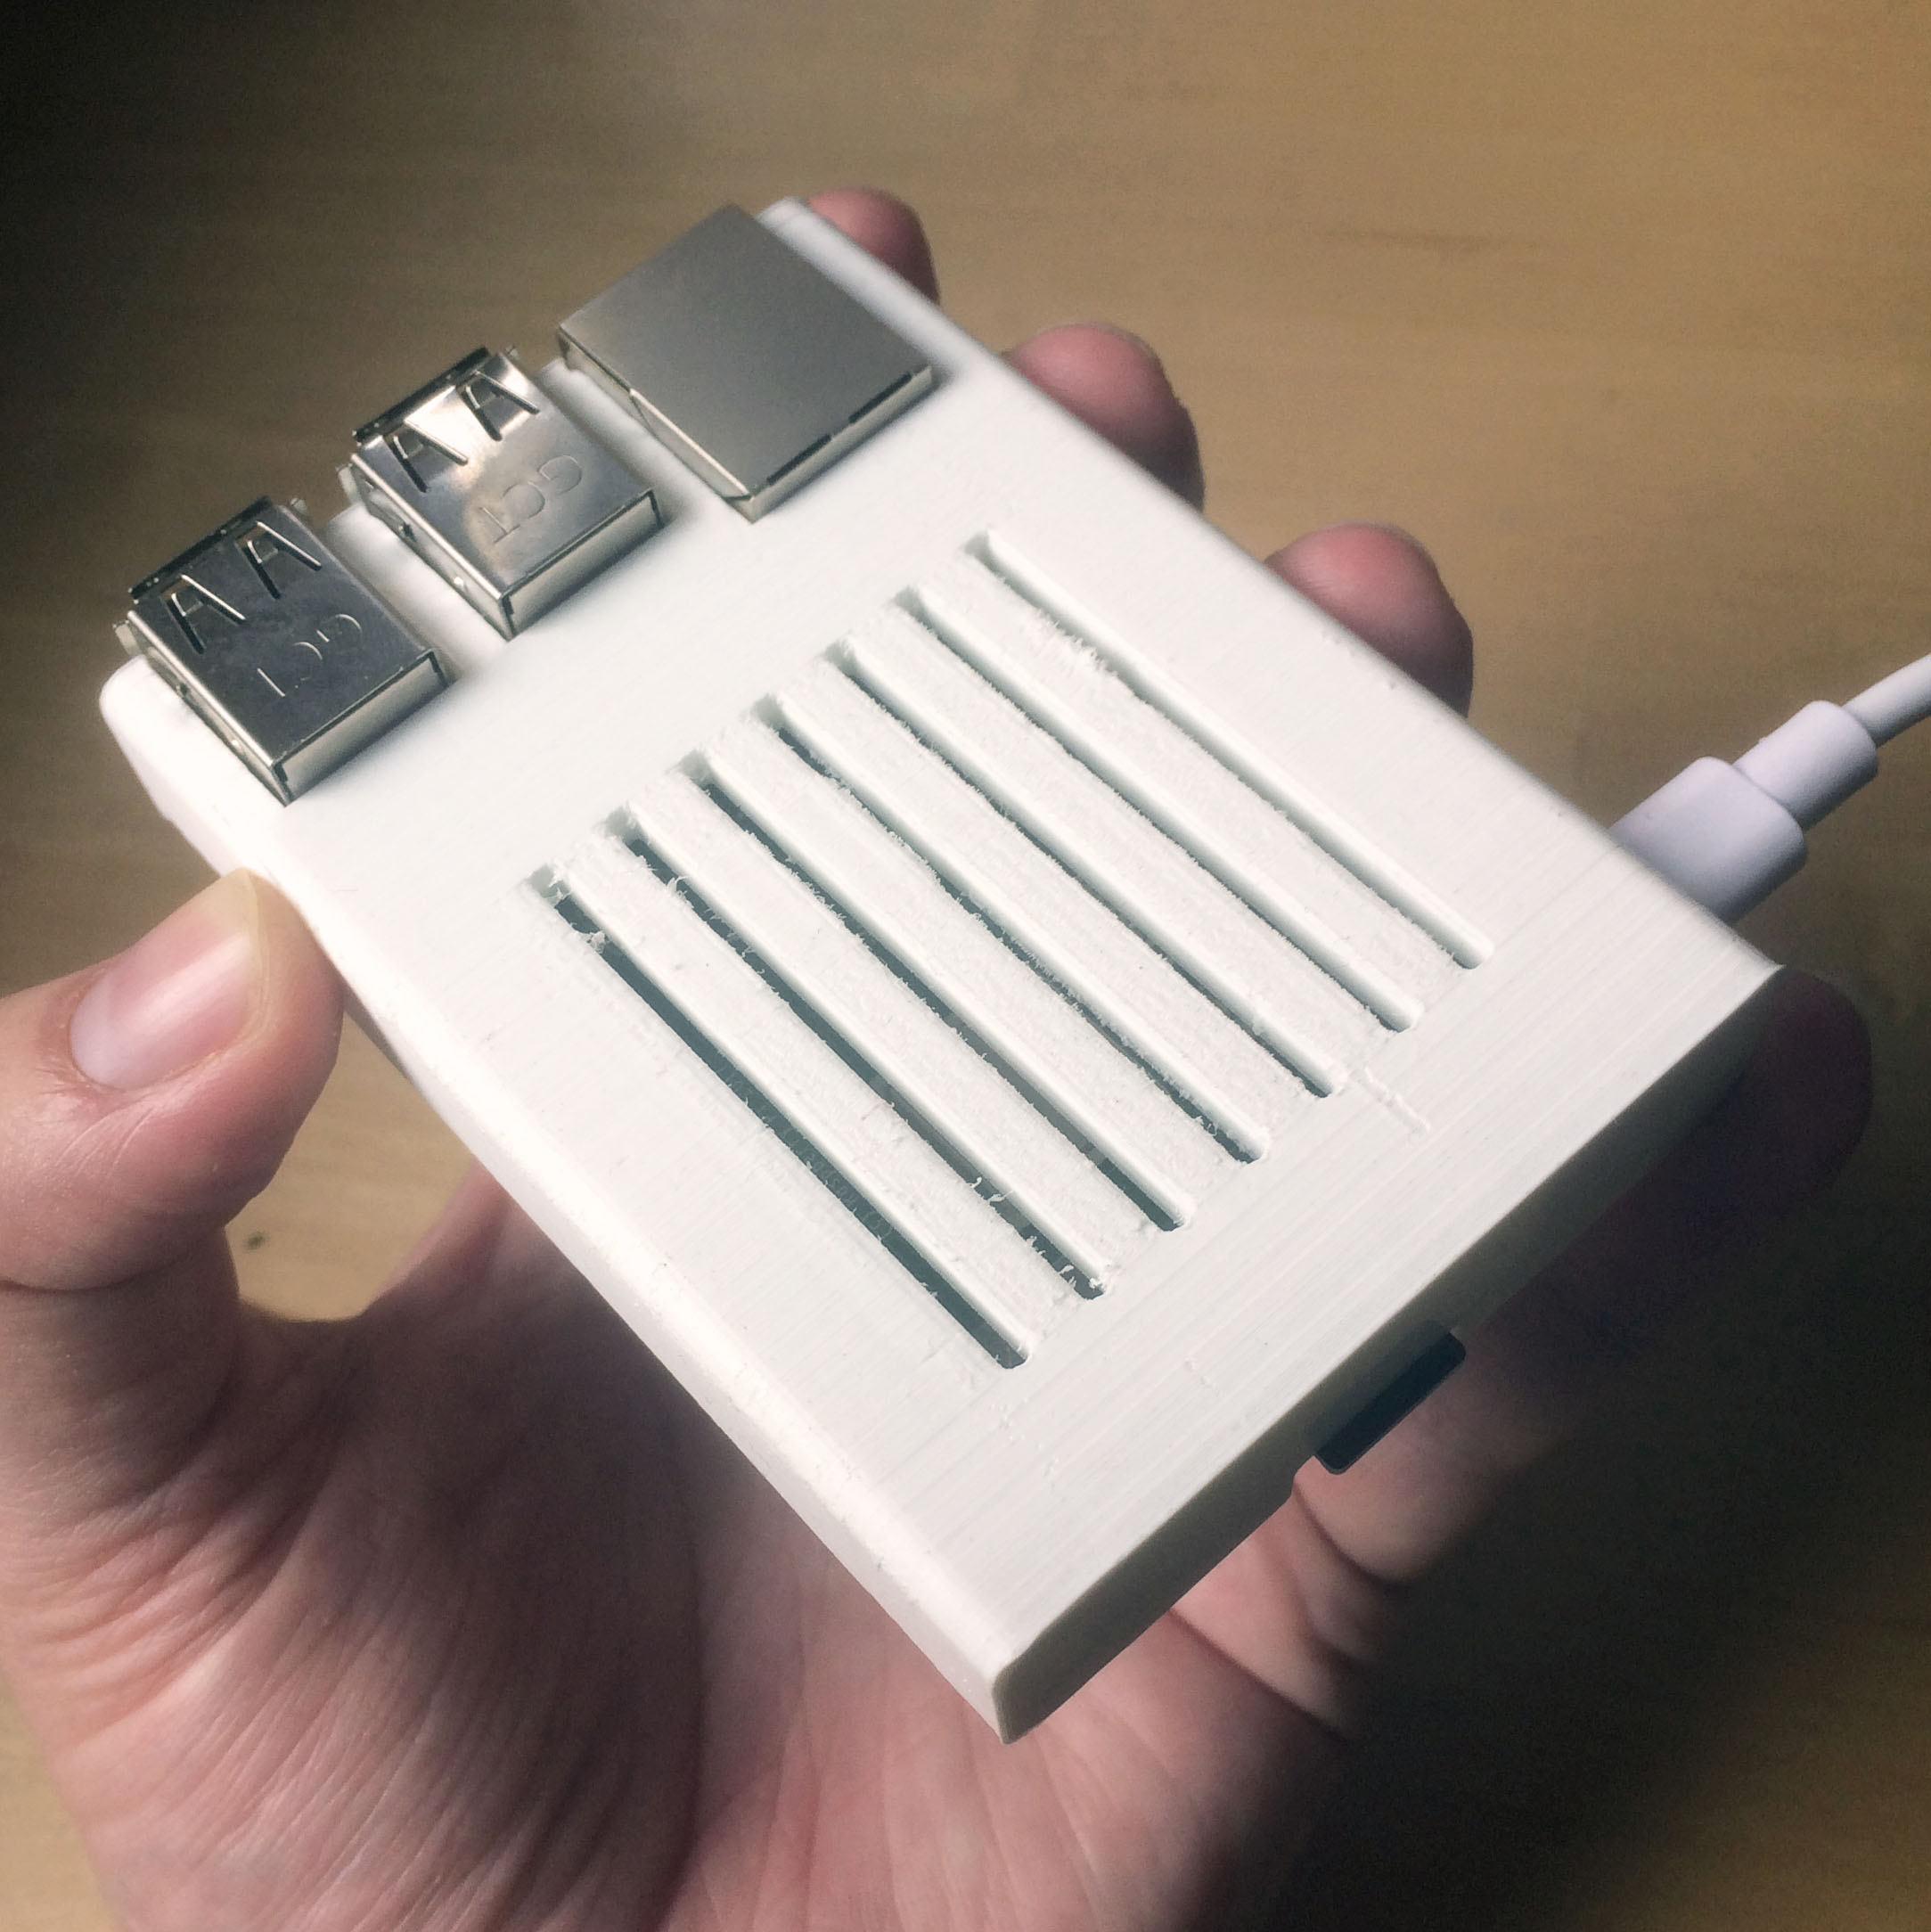
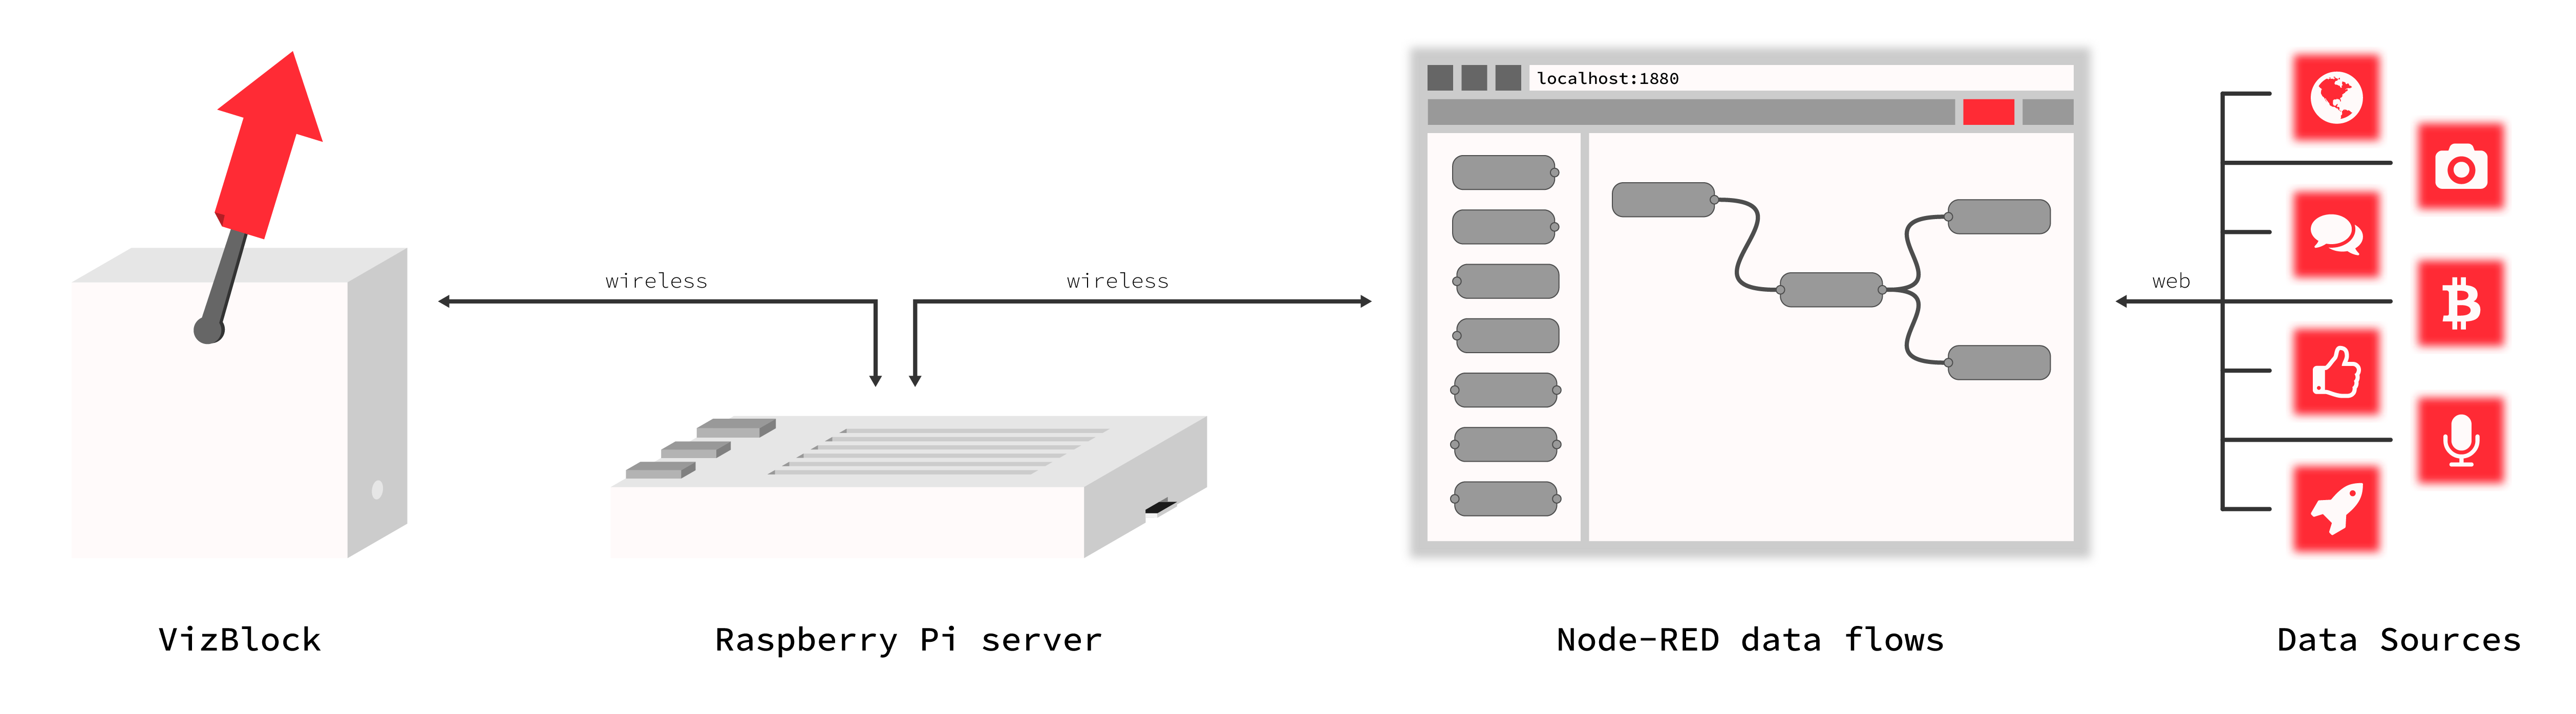
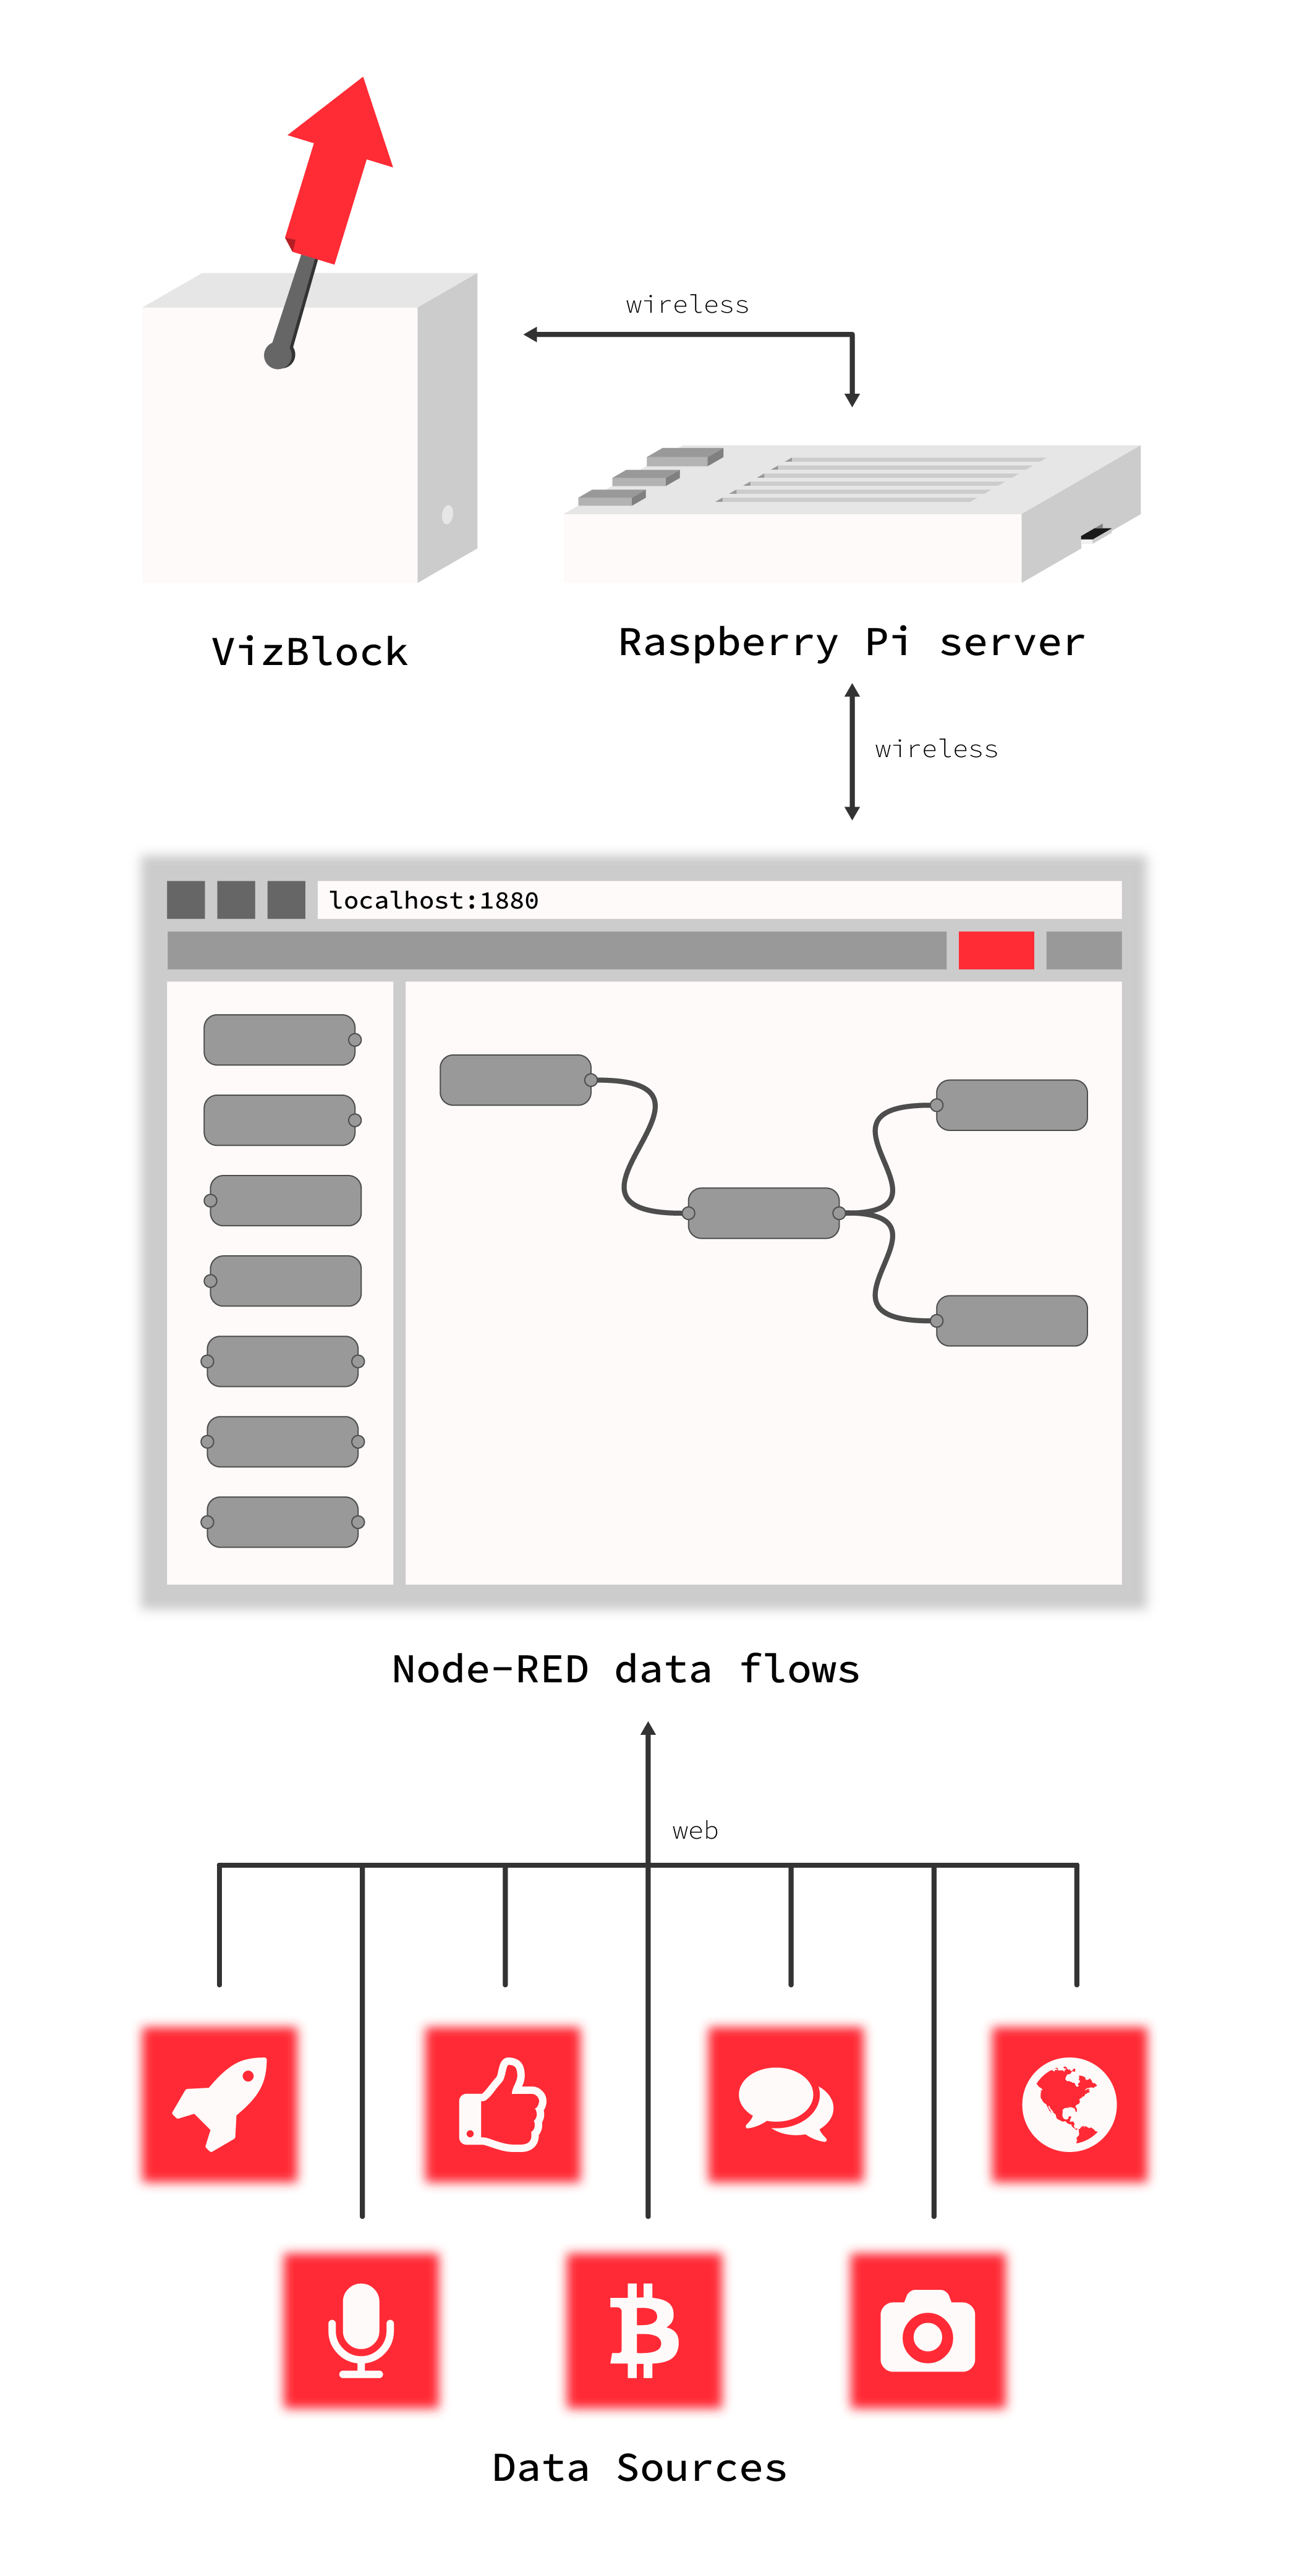
The VizBlocks Server is the brains of the operation. It uses a tiny Raspberry Pi computer to run a visual programming language app, called Node-RED, to connect the blocks you have in the world to the data streams you want to visualise. See how to get started with it by visiting our tutorials page.
The VizBlocks system uses a mix of hardware and open source software to support users to build their own data visualisation projects. Don't be afraid if it seems complicated, the toolkit is designed for beginners with a bunch of handy tools to help you get to grips with each component so you can start playing with data ASAP.